
ARM is committed to responsible and sustainable mining and beneficiation, with zero tolerance for harm to employees, contractors, host communities and the environment.
The board is the foundation of the corporate governance system and is accountable for ARM’s performance, which includes sustainable development. It ensures the company’s long-term strategy and purpose are implemented sustainably and that business is conducted ethically and with integrity.
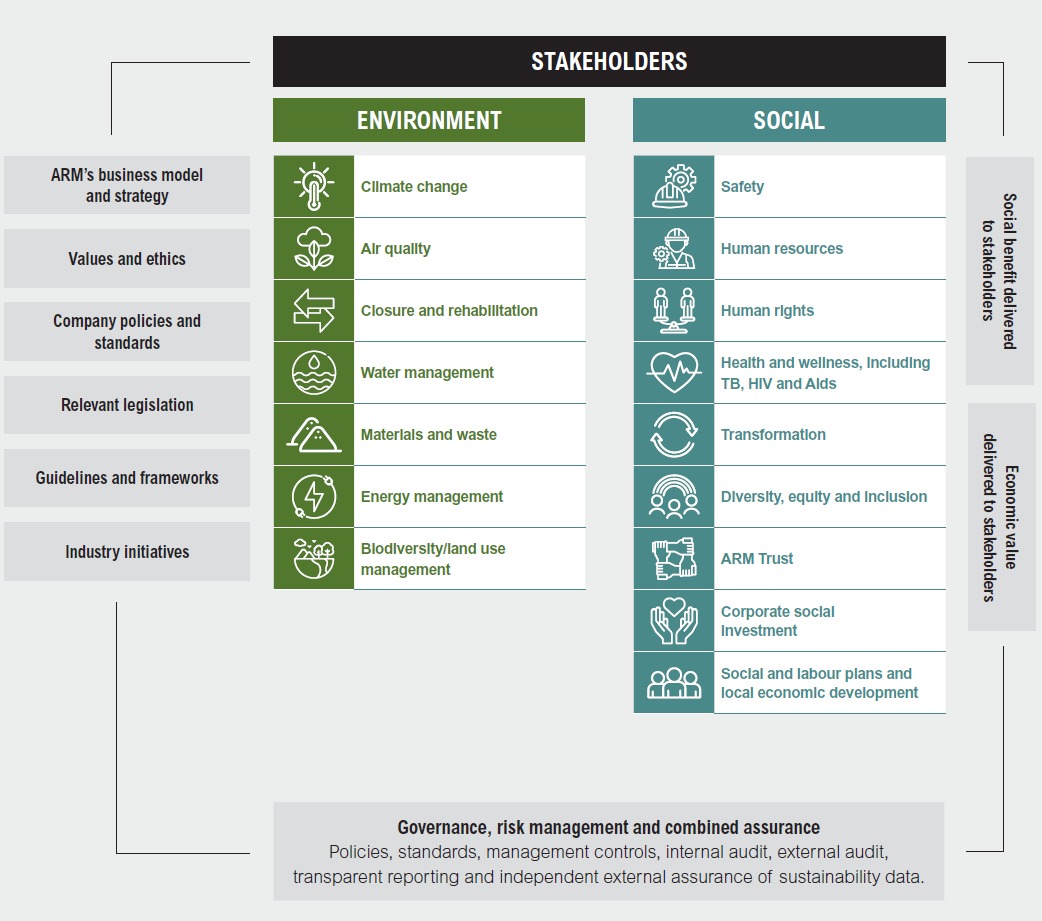
The board has delegated responsibility to the ARM social and ethics committee to monitor and report on the manner and extent to which the company protects, enhances and invests in the wellbeing of the economic, The board is the foundation of the corporate governance system and is accountable for ARM’s performance, which includes sustainable development. It ensures the company’s long-term strategy and purpose are implemented sustainably and that business is conducted ethically and with integrity.social and environmental contexts in which we operate to ensure that our business practices are sustainable. The committee is chaired by Dr RV Simelane and comprises five non-executive board members.
ESG risks and sustainable development matters and performance are included in the enterprise risk management (ERM) process. ERM forms part of the formal agenda of the management risk and compliance committee, a subcommittee of the audit and risk committee.
The ARM executive: sustainable development operates with oversight from the social and ethics committee and develops, implements and reviews sustainability policies, standards, strategies and targets to ensure these align with the board’s commitment to responsible corporate citizenship. She also attends board meetings to respond to any sustainability-related matters raised by the board. The risk department reports on risk-related matters, which include ESG matters, under the oversight of the finance director.
The effectiveness of our approach to sustainable development is assessed through key performance indicators and related matters that are regularly monitored at operational, divisional, executive and board levels. We also monitor related information from engagements with our key stakeholders. The combined assurance model (see page 112 of the ESG report) provides a sound basis for evaluating the appropriateness and reliability of ARM’s sustainability processes, controls and information.
In ARM Ferrous, the Assmang social and ethics committee oversees the sustainability performance of the operations, except for Machadodorp Works. Quarterly meetings ensure comprehensive reporting at operational level. The committee is chaired by the ARM executive: investor relations and new business development.
Sustainable development committees for the ARM Platinum operations report to the executive committee or board of the respective joint ventures, as appropriate. These committees are chaired by the ARM executive: sustainable development.
The committees report on sustainability-related performance and compliance to the ARM social and ethics committee at quarterly meetings.

| Performance indicator as at 30 June | Assured | F2024 | F2023 | F2022 | F2021 | F2020 |
| Economic and related core baseline indicators (segmental) | ||||||
| Sales (Rm) | 11 418 | 14 662 | 38 208 | 44 564 | 27 370 | |
| Taxes (Rm) | 1 608 | 3 469 | 4 817 | 6 506 | 2 805 | |
| Headline earnings (Rm) | 5 080 | 8 983 | 11 338 | 13 064 | 5 534 | |
| EBITDA (Rm) | 1 049 | 5 829 | 17 839 | 24 321 | 11 009 | |
| Number of environmental administrative penalties/fines | 1 | – | – | – | – | |
| Employee indicators (100% basis) | ||||||
| Total number of ARM employees and contractors1 | 23 369 | 22 931 | 21 610 | 20 928 | 20 998 | |
| – Employees (permanent) | 13 670 | 13 477 | 12 707 | 12 335 | 12 678 | |
| – Contractors (mainly used in capital projects) | 9 699 | 9 454 | 8 903 | 8 593 | 8 320 | |
| Employee turnover (excluding contractors) (%) | 7.4 | 6.5 | 5.2 | 10.1 | 6.3 | |
| Investment in employee training and development | ||||||
| – Total expenditure (Rm) | 399 | 371 | 198 | 239 | 225 | |
| – % of payroll | 8.8 | 9.3 | 7.1 | 6.9 | 6.8 | |
| Employment equity (% previously disadvantaged groups per category) | ||||||
| – Top management | 73 | 75 | 67 | 65 | 61 | |
| – Senior management | 70 | 66 | 64 | 57 | 52 | |
| – Professionally qualified | 78 | 76 | 73 | 69 | 68 | |
| – Technically qualified | 86 | 84 | 82 | 80 | 79 | |
| Safety and health | ||||||
| – Total work-related fatalities | ✓ | 1 | 1 | 2 | 2 | 2 |
| – Fatality frequency rate (FFR)2 | ✓ | 0.004 | 0.005 | 0.010 | 0.010 | 0.010 |
| – Lost-time injury frequency rate (LTIFR)2 | ✓ | 0.22 | 0.27 | 0.31 | 0.41 | 0.45 |
| – Total recordable injury frequency rate (TRIFR)2 | ✓ | 0.50 | 0.62 | 0.70 | 0.81 | 0.92 |
| – Reportable/serious accidents | 43 | 44 | 42 | 55 | 63 | |
| – Total occupational diseases submitted for compensation | ✓ | 24 | 15 | 13 | 18 | 19 |
| – Total number of cases of noise-induced hearing loss (NIHL) submitted for compensation | ✓ | 23 | 15 | 13 | 18 | 11 |
| – Total number of new pulmonary TB cases3 | ✓ | 19 | 21 | 18 | 34 | 46 |
| – Employees and contractors receiving antiretroviral treatment at ARM operations | 1 320 | 1 239 | 1 398 | 2 575 | 3 168 | |
| Number of lost man-days due to industrial action | – | – | – | 110 | – | |
| Environmental indicators | ||||||
| Total volume of water withdrawal (m3) | ✓ | 24 503 219 | 21 274 743 | 17 393 796 | 20 034 604 | 21 773 441 |
| – Total operational water withdrawal (m3) (municipal, surface and groundwater) | 23 253 064 | 18 291 911 | 16 803 679 | 19 380 928 | 18 967 229 | |
| – Other managed water/diversions (m3) | 1 250 155 | 2 982 832 | 590 117 | 653 676 | 1 300 439 | |
| Water output (m3) | 2 508 616 | 733 063 | 242 836 | 866 552 | 1 045 647 | |
| Total energy used (GJ)4 | ✓ | 7 400 278 | 7 693 348 | 7 577 456 | 8 444 099 | 8 642 520 |
| Energy use | ||||||
| – Electricity (MWh) | ✓ | 1 330 731 | 1 331 182 | 1 380 623 | 1 542 908 | 1 563 311 |
| – Diesel (000 litres) | ✓ | 78 433 | 79 213 | 71 241 | 78 853 | 82 572 |
| Emissions | ||||||
| Carbon emissions (equivalent tonnes CO2) (100%) | ||||||
| – Scope 1 and 2 | ✓ | 1 695 526 | 1 804 578 | 1 879 449 | 2 016 832 | 2 060 511 |
| – Scope 3 | ✓ | 56 402 411 | 59 402 936 | * | * | * |
| Direct emissions | ||||||
| – NOx (tonnes) | 391 | 374 | 366 | 372 | 398 | |
| – SOx (tonnes) | 234 | 249 | 257 | 263 | 274 | |
| – Particulate matter (tonnes) | 311 | 213 | 276 | 290 | 267 | |
| Corporate social responsibility | ||||||
| Total CSI and LED spend (Rm) | ✓ | 189.0 | 123.9 | 150.4 | 170.4 | 130.3 |
| – CSI (Rm) | 53.1 | 41.4 | 34.6 | 45.2 | 44.7 | |
| – LED (Rm) | 135.9 | 82.5 | 115.8 | 125.3 | 85.6 | |
| ARM BBEE Trust (Rm) (projects) | 23.2 | 33.16 | 19.8 | 10.9 | 14.5 | |
| Governance indicators | ||||||
| ARM’s King IV application register | ✓ | Y | Y | Y | Y | Y |
| Board diversity | ||||||
| – Diversity (black) (%)5 | 60 | 56 | 56 | 56 | 58 | |
| – Gender (female) (%) | 20 | 22 | 25 | 25 | 25 | |
| – Independent non-executive directors (%) | 80 | 67 | 63 | 63 | 56 |
Non-financial data is stated on a 100% basis.
1 Total number of ARM employees and contractors as at 30 June.
2 Injury rates are measured per 200 000 man-hours and include both ARM employees and contractor incidents.
3 Reported for the 12 months to December in line with the regulatory reporting requirements.
4 Total energy used was assured for the first time in F2022.
5 Excludes non-South African director.
6 Restated to correct prior misstatement
✓ Limited assurance provided by KPMG Inc.
* Not reported.