
Our headline earnings for F2024 decreased by 43%, largely attributed to the decline in the average US dollar 6E PGM basket price and lower thermal coal prices. This was partially offset by a weaker average rand/US dollar exchange rate and higher average realised export iron ore prices. ARM declared a final dividend of R9.00 per share.
Tsundzukani Mhlanga
Finance director
| R million | F2024 | F2023* | % change |
| ARM Ferrous | 5 058 | 5 528 | (9) |
|---|---|---|---|
| Iron ore division | 4 933 | 4 158 | 19 |
| Manganese division | 143 | 1 372 | (90) |
| Consolidation adjustment | (18) | (2) | >(200) |
| ARM Platinum | (910) | 1 465 | (162) |
| Two Rivers Mine | 168 | 1 262 | (87) |
| Modikwa Mine | (121) | 819 | (115) |
| Bokoni Mine | (566) | (406) | (39) |
| Nkomati Mine | (391) | (210) | (86) |
| ARM Coal | 391 | 1 535 | (75) |
| Goedgevonden Mine | 331 | 540 | (39) |
| PCB operations** | 60 | 995 | (94) |
| ARM Corporate and other | 541 | 455 | 19 |
| Corporate and other (including gold) | 762 | 651 | 17 |
| Machadodorp Works | (221) | (196) | 13 |
| Headline earnings | 5 080 | 8 983 | (43) |
 * Comparative information has been restated. Refer to note 23 of the annual financial statements for more detail.
** PCB refers to Participative Coal Business.
As we navigate the current commodity cycle, our priority is to ensure a disciplined capital allocation and implement cost-saving initiatives. We aim to deliver value to our shareholders, even in challenging market conditions.
SALIENT features for F2024
Basic earnings of R3 146 million (F2023: R8 080 million restated) included attributable impairments of property, plant and equipment at:
The impairments at our platinum operations were largely due to the significant decrease in profitability resulting from lower PGM commodity prices.
|
Refer to note 38 of the annual financial statements for further details. |
Group headline earnings for F2024 decreased by 43% to R5 080 million or R25.91 per share (F2023: R8 983 million or R45.82 per share restated). This was mainly due to the decline in the average US dollar 6E PGM basket price and lower thermal coal prices. It was partially offset by a weaker average rand/US dollar exchange rate and higher average realised export iron ore prices.
The average realised rand weakened 5% versus the US dollar to R18.70/US$ compared to R17.76/US$ in F2023. For reporting purposes, the closing exchange rate at 30 June 2024 was R18.25/US$ (30 June 2023: R18.90/US$).
Group statement of profit or loss
for the year ended 30 June 2024
Hover over the table rows to view additional comments.
| R million | 30 June 2024 |
30 June 2023* |
| Revenue | 12 921 | 16 097 |
|---|---|---|
| Sales | 11 418 | 14 662 |
| Cost of sales | (10 541) | (8 836) |
| Gross profit | 877 | 5 826 |
| Other operating income | 1 914 | 1 755 |
| Insurance revenue | 45 | 64 |
| Other operating expenses | (2 729) | (2 632) |
| Insurance service expenses | (6) | (37) |
| Net expenses from reinsurance contracts held | (25) | (23) |
| Profit from operations before capital items | 76 | 4 953 |
| Income from investments | 1 123 | 868 |
| Finance costs | (192) | (242) |
| Net finance expenses from insurance contracts issued | (6) | (4) |
| Net finance expenses from reinsurance contracts held | (57) | (40) |
| Share of profit from associate | 60 | 1 007 |
| Share of profit from joint venture | 4 592 | 4 557 |
| Profit before taxation and capital items | 5 596 | 11 099 |
| Capital items before tax | (3 396) | 56 |
| Profit before taxation | 2 200 | 11 155 |
| Taxation | 96 | (1 833) |
| Profit for the year | 2 296 | 9 322 |
| Attributable to: | ||
| Equity holders of ARM | ||
| Profit for the year | 3 146 | 8 080 |
| Basic earnings for the year | 3 146 | 8 080 |
| Non-controlling interest | ||
| (Loss)/profit for the year | (850) | 1 242 |
| (850) | 1 242 | |
| Profit for the year | 2 296 | 9 322 |
| Earnings per share | ||
| Basic earnings per share (cents) | 1 604 | 4 121 |
| Diluted basic earnings per share (cents) | 1 603 | 4 112 |
* Comparative information has been restated after adopting IFRS 17 Insurance contracts.
Refer to note 23 of the annual financial statements for further details.
At 30 June 2024, ARM had net cash of R7 197 million (30 June 2023: R9 779 million), a decrease of R2 582 million largely driven by an increase in borrowings of R887 million at Two Rivers Mine. This amount excludes attributable cash and cash equivalents held at ARM Ferrous (50% of Assmang) of R4 476 million (30 June 2023: R4 939 million).
Group statement of financial position
at 30 June 2024
Hover over the table rows to view additional comments.
| R million | 30 June 2024 |
30 June 2023 |
| ASSETS | ||
| Non-current assets | ||
| Property, plant and equipment | 18 128 | 16 173 |
| Investment properties | 25 | 24 |
| Intangible assets | 50 | 55 |
| Deferred tax assets | 921 | 935 |
| Non-current financial assets | 187 | 128 |
| Reinsurance contract asset | 16 | – |
| Investment in associate | 1 467 | 1 847 |
| Investment in joint venture | 21 341 | 21 814 |
| Other investments | 12 857 | 6 148 |
| Non-current inventories | 330 | 427 |
| 55 322 | 47 551 | |
| Current assets | ||
| Inventories | 788 | 488 |
| Trade and other receivables | 5 187 | 5 118 |
| Insurance contract asset | 21 | – |
| Reinsurance contract asset | 8 | – |
| Taxation | 223 | 178 |
| Financial assets | 817 | 661 |
| Cash and cash equivalents | 8 326 | 10 021 |
| 15 370 | 16 466 | |
| Total assets | 70 692 | 64 017 |
| EQUITY AND LIABILITIES | ||
| Capital and reserves | ||
| Ordinary share capital | 11 | 11 |
| Share premium | 5 267 | 5 267 |
| Treasury shares | (2 405) | (2 405) |
| Other reserves | 9 485 | 4 310 |
| Retained earnings | 41 648 | 42 031 |
| Equity attributable to equity holders of ARM | 54 006 | 49 214 |
| Non-controlling interest | 4 081 | 4 931 |
| Total equity | 58 087 | 54 145 |
| Non-current liabilities | ||
| Long-term borrowings | 631 | 206 |
| Deferred tax liabilities | 4 635 | 3 787 |
| Insurance contract liabilities | 33 | – |
| Long-term provisions | 1 812 | 2 257 |
| 7 111 | 6 250 | |
| Current liabilities | ||
| Trade and other payables | 2 554 | 1 522 |
| Short-term provisions | 1 231 | 834 |
| Insurance contract liabilities | 16 | 73 |
| Reinsurance contract liabilities | 850 | 713 |
| Taxation | 345 | 444 |
| Overdrafts and short-term borrowings – interest-bearing | 498 | 36 |
| 5 494 | 3 622 | |
| Total equity and liabilities | 70 692 | 64 017 |
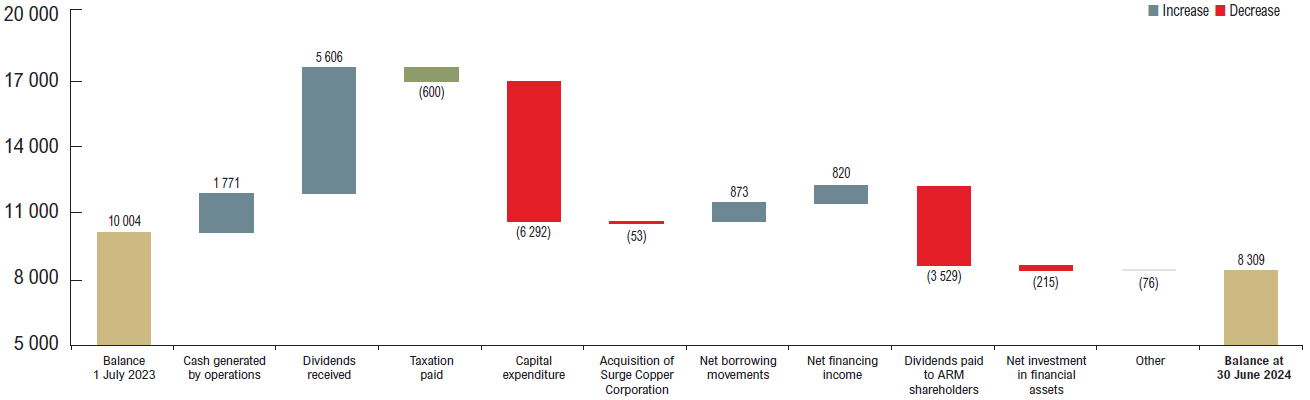
Cash generated from operations decreased by R6 319 million to R1 771 million (F2023: R8 090 million) after an outflow in working capital of R130 million (F2023: R1 212 million inflow). This was mainly due to an outflow in trade payables and reduction in receivables inflow.
ARM Corporate received dividends from its underlying operations and investments per the table below:
Dividends received by ARM Corporate
| R million | 30 June 2024 |
30 June 2023 |
| Assmang | 5 000 | 5 000 |
|---|---|---|
| PCB operations | 422 | 598 |
| Two Rivers Mine | – | 486 |
| Harmony Gold | 166 | 17 |
| Total dividends received | 5 588 | 6 101 |
In F2024, ARM paid R3 529 million in dividends to its shareholders, representing the interim dividend of R6.00 and final dividend of R12.00 per share declared for F2023 (F2023: R6 666 million representing the interim dividend of R14.00 and F2022 final dividend of R20.00 per share).
Net cash outflow from investing activities was R6 556 million (F2023: R7 511 million) and included R4 742 million in additions to property, plant and equipment to expand operations. Of this, R3 138 million was attributable to the Two Rivers Merensky project.
Borrowings of R62 million (F2023: R251 million) were repaid and borrowings of R935 million raised during the period, resulting in gross debt of R1 129 million at 30 June 2024 (30 June 2023: R242 million).
Analysis of movements in net cash and cash equivalents (R million)
Group statement of cash flows
for the year ended 30 June
Hover over the table rows to view additional comments.
| R million | 30 June 2024 |
30 June 2023 |
| CASH FLOW FROM OPERATING ACTIVITIES | ||
| Cash receipts from customers | 13 675 | 18 697 |
| Cash paid to suppliers and employees | (11 904) | (10 607) |
| Cash generated from operations | 1 771 | 8 090 |
| Interest received | 917 | 840 |
| Interest paid | (97) | (69) |
| Taxation paid | (600) | (1 517) |
| 1 991 | 7 344 | |
| Dividends received from joint venture | 5 000 | 5 000 |
| Dividends received from associates | 440 | 1 208 |
| Dividends received from investments – Harmony | 166 | 17 |
| Dividend paid to non-controlling interests | – | (660) |
| Dividend paid to shareholders | (3 529) | (6 666) |
| Net cash inflow from operating activities | 4 068 | 6 243 |
| CASH FLOW FROM INVESTING ACTIVITIES | ||
| Acquisition of Bokoni net of cash acquired | – | (3 441) |
| Acquisition of investment in Surge Copper Corporation | (53) | – |
| Additions to property, plant and equipment to maintain operations | (1 550) | (1 995) |
| Additions to property, plant and equipment to expand operations | (4 742) | (2 461) |
| Proceeds on disposal of property, plant and equipment | 4 | 6 |
| Investments in financial assets | (893) | (724) |
| Proceeds from financial assets matured | 678 | 1 011 |
| Proceeds from loans | – | 93 |
| Net cash outflow from investing activities | (6 556) | (7 511) |
| CASH FLOW FROM FINANCING ACTIVITIES | ||
| Cash payments to owners to acquire the entity’s shares | (78) | (141) |
| Long-term borrowings raised | 479 | – |
| Long-term borrowings repaid | (48) | (80) |
| Short-term borrowings raised | 456 | – |
| Short-term borrowings repaid | (14) | (171) |
| Net cash outflow from financing activities | 795 | (392) |
| Net increase in cash and cash equivalents | (1 693) | (1 660) |
| Cash and cash equivalents at beginning of year | 10 004 | 11 643 |
| Net foreign exchange difference | (2) | 21 |
| Cash and cash equivalents at end of year | 8 309 | 10 004 |
| Made up as follows: | ||
| – Available | 7 625 | 9 183 |
| – Cash set aside for specific use | 684 | 821 |
| 8 309 | 10 004 | |
| Overdrafts | 17 | 17 |
| Cash and cash equivalents per statement of financial position | 8 326 | 10 021 |
| Cash generated from operations per share (cents) | 903 | 4 127 |
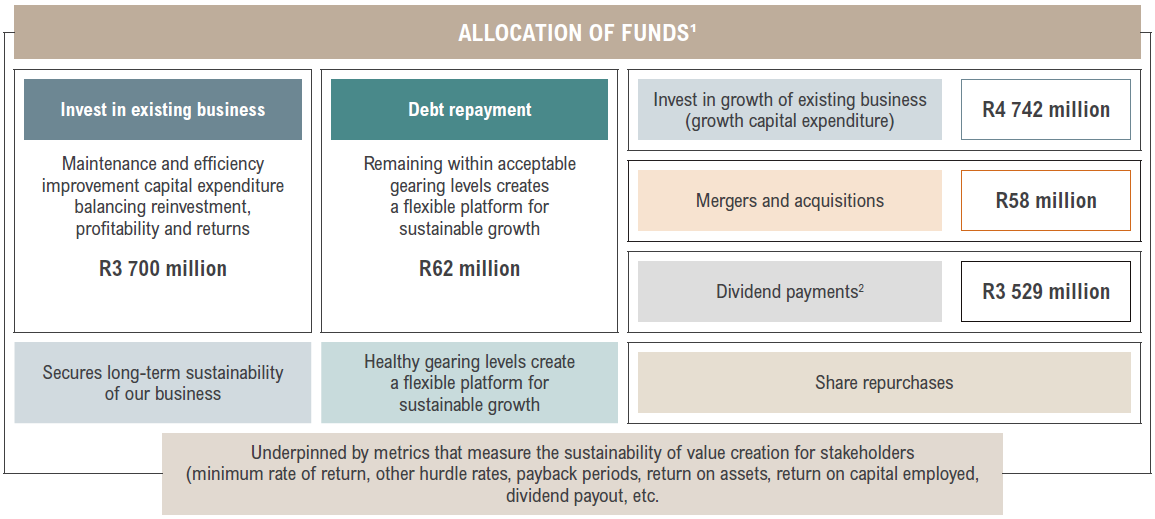
1 Allocation of capital on a segmental basis, including ARM Ferrous.
2 Includes only dividends paid to ARM shareholders.
Segmental capital expenditure was R8 564 million (F2023: R7 201 million) and included R668 million of capitalised waste stripping at the iron ore operations (F2023: R681 million).
In addition to sustaining (or stay-in-business) capital expenditure, capital was invested in the growth of the existing business in F2024. Expansionary capital expenditure of R3 138 million was spent on the Merensky project at Two Rivers Mine. A decision was made to place the project on care and maintenance from July 2024, driven by current depressed commodity prices in the PGM market. The Merensky concentrator plant construction and first two mining levels have been completed. Of the R1 754 million spent at Bokoni Platinum Mine, R460 million related to the early ounce project and R768 million to mine development.
Capital expenditure for the divisions is shown below and discussed in each division’s operational review.
Capital expenditure by operation/division (attributable basis)
| R million | F2024 | F2023 | % change |
| ARM Ferrous | 2 209 | 2 440 | (9) |
|---|---|---|---|
| Iron ore division | 1 607 | 1 707 | (6) |
| Manganese division | 697 | 841 | (17) |
| Consolidation adjustment | (95) | (108) | (12) |
| ARM Platinum | 6 139 | 4 420 | 39 |
| Two Rivers Mine | 3 968 | 3 167 | 25 |
| Modikwa Mine | 417 | 561 | (26) |
| Bokoni Mine | 1 754 | 692 | 153 |
| ARM Coal (Goedgevonden Mine only) | 202 | 331 | (39) |
| ARM Corporate | 14 | 10 | 40 |
| Total | 8 564 | 7 201 | 19 |
Funds allocated to debt repayment
Borrowings of R62 million (F2023: R251 million) were repaid and borrowings of R935 million raised during the period, resulting in gross debt of R1 129 million at 30 June 2024 (30 June 2023: R242 million). Two Rivers Mine has a syndicated revolving credit facility of R1 billion, financed by Absa and Nedbank at an interest rate of 10.05%.
There was no debt at ARM Ferrous in either of the reporting periods.
Funds allocated to dividend payments
In line with the board-approved dividend guiding principle, ARM aims to pay ordinary dividends to shareholders equal to 40% to 70% of annual dividends received from its group companies.
For F2024, the board has approved and declared a final dividend of R9.00 per share (F2023: R12.00). In addition to the interim dividend of R6.00 per share (F2023: R14.00) paid on 8 April 2024, this brings the total dividend for F2024 to R15.00 per share (F2023: R26.00).
Dividends declared as a percentage of dividends received from underlying operations were 58% (F2023: 82%).
Subsequent to year end Assmang declared a dividend of R2 500 million attributable to ARM.
Harmony declared a final dividend of 94 cents per share. At 30 June 2024 and at the date of this report, ARM owned 74 665 545 Harmony shares.
ARM declared a dividend of 900 cents per share on 6 September 2024.
Nkomati
The Competition Tribunal has unconditionally approved the transaction between African Rainbow Minerals Limited (ARM) and Norilsk Nickel Africa Proprietary Limited (Norilsk) in terms of which ARM is acquiring Norilsk’s participation interest in the Nkomati Joint Venture. Other outstanding conditions precedent relating to the transaction are still to be fulfilled.
Two Rivers
Two Rivers entered into a syndicated facility of R2 500 million on 29 August 2024 financed by Absa and Nedbank, consisting of a revolving credit facility of R1 250 million and a term loan of R1 250 million. The interest rate for the revolving credit facility and term loan is based on the Johannesburg Interbank Average rate plus a margin of 2.10% and 1.95% respectively. The revolving credit facility and term loan has a maturity date of 29 August 2029.
No other significant events have occurred subsequent to the reporting date that could materially affect the reported results or require further disclosure.
Tsundzukani Mhlanga
Finance director
25 October 2024