
Safety and health
The group recorded zero fatalities in F2026 (F2025: three). This is a significant milestone, with the last fatality-free year recorded in F2017.
The group's LTIFR improved by 9% to 0.29 per 200 000 man-hours (F2025: 0.31) and the TRIFR regressed by 11% to 0.56 (F2025: 0.50).
Key safety achievements recorded in F2026 included:
ARM remains committed to ensuring a safe and healthy work environment for all employees and to achieving our goal of zero harm. We continue to advance this commitment by embedding critical control management processes, focusing on leading and lagging indicators and implementing advanced safety technologies such as level 9 collision avoidance systems.
An integrated wellness management programme is implemented at all our operations to prevent occupational health hazards from affecting employee health. The programme actively identifies and manages health risks and chronic conditions that may affect wellness and quality of life. In F2026, 20 cases (F2025: 25 cases) of noise-induced hearing loss1 (NIHL) were submitted for compensation. The cases have been reported to the Department of Mineral and Petroleum Resources (DMPR) and submitted to Rand Mutual Assurance (RMA) for possible compensation.
Hearing conservation continues to be a focus of occupational health surveillance and management programmes. Operations have several initiatives to reduce noise exposure, such as providing customised hearing protection devices (HPDs) to exposed employees and ensuring that all machines at our operations are below the milestone level of 104dBA.
Environmental management
Greenhouse gas (GHG) emissions performance1
Scope 1 and 2 emissions decreased by 33%, mainly due to reduced activities at Beeshoek Mine, Bokoni Mine, Cato Ridge Works and the adoption of renewable energy at the ARM Platinum operations (Bokoni, Modikwa and Two Rivers mines).
1 At the time of publication, the F2026 environmental, social and governance (ESG) assurance was ongoing.
Comparison of F2026 and F2025 Scope 1 and 2 emissions
| Tonnes of carbon dioxide equivalents (tCO2e) | F2026 | F2025 | % change |
| Scope 1 | 221 152 | 347 617 | (36) |
|---|---|---|---|
| Scope 2 | 838 011 | 1 223 178 | (31) |
| Scope 1 and 2 | 1 059 163 | 1 570 795 | (33) |
|
Scope 1: GHG emissions released directly by an organisation through its activities, eg diesel, petrol, etc. Scope 2: indirect GHG emissions associated with the purchase of electricity, steam, heat or cooling. |
Decarbonisation journey to net zero and transition to climate resilience
At the end of F2023, ARM published its short-term target (F2026) of reducing Scope 1 and 2 emissions by 15% and its medium-term target (F2030) of reducing emissions by 30%. Identified decarbonisation pathways included improving energy efficiency, implementing renewable energy and adopting new energy vehicles.
In December 2023, the International Council on Mining and Metals (ICMM) published its Scope 3 emissions target-setting guidance, which has been developed to support mining and metals companies in setting targets to reduce Scope 3 (value chain) emissions. In F2024, ARM set qualitative Scope 3 targets with a commitment to set quantitative targets by F2027. Work is underway to develop the quantitative targets.
Increasing access to and use of renewable energy
ARM Platinum
ARM made meaningful progress toward its renewable energy ambitions during the period, with construction of the 100MW solar plant now complete, achieving over 1.2 million LTI-free man-hours in the process. The long-term power purchase agreement (PPA) is expected to deliver substantial environmental and financial benefits, including an estimated 30% reduction in ARM Platinum’s CO2 emissions and total savings of approximately 4.8 million tonnes of CO2 equivalents over the 20-year term.
Despite temporary export constraints at the high voltage distribution substation, ARM's PGM operations began receiving up to 50MW of renewable power in December 2025, with the full 100MW export capacity expected once the grid upgrades are completed in Q1 F2027.
ARM Ferrous
ARM Ferrous completed the adjudication process for a potential PPA with an independent power producer (IPP) as part of its medium to long-term energy strategy. Following the evaluation, a decision was taken to defer the conclusion of a short-term agreement, as the required power capacity was not immediately available for deployment in the market.
A long-term decision will be finalised once there is clarity on a firm tariff structure, as well as alignment on key terms and conditions that are consistent with the remaining operational life of ARM Ferrous' assets in the Northern Cape. The final decision is expected to be concluded by the end of December 2026.
Water management
The water supply to Khumani Mine remained consistent during the second half of F2026, with no disruptions experienced from water shortages. This was supported by several factors, including consistent water supply from the Vaal Gamagara water supply scheme (VGGWSS), increased rainfall during the period and supplementary process water secured from neighbouring mines.
However, continued pipe failures within the VGGWSS highlight the need for a refurbishment plan under the Phase 2 project. The engineering design phase and specialist studies for this project are progressing well, with completion expected by the end of June 2027.
Additionally, Khumani Mine is exploring alternative water supply options to mitigate this risk and potentially achieve water independence.
Tailings management
ARM, as a member of the ICMM, remains committed to operating Tailings Storage Facilities (TSF) in line with global best practices as set out by the Global Industry Standard on Tailings Management (GISTM) and company policies.
ARM submitted its GISTM conformance results with its public disclosure report for all its TSFs on 5 August 2025. For F2026 and beyond, the ARM GISTM conformance results and public disclosure will be published with the ARM annual reporting suite. Reviews by the Independent Tailings Review Board (ITRB) were conducted in May 2026. These reviews by the ITRB are conducted annually to assess the safety of the TSFs in terms of design, construction, operation, monitoring, management and governance, and performance against the design intent.
Measures to improve the stability of the Modikwa TSF are in progress. Extensive work was carried out from 2023 to date to ensure that the TSF complies with industry and internal standards and best practice guidelines. As part of this work, Modikwa commissioned an intensive geotechnical investigation to evaluate the characteristics of both the foundation and tailings material. The investigations were conducted to assess how best to improve the stability of the TSF under certain potential extreme conditions over the remaining life of the TSF to 2052. As part of the geotechnical investigation, the trial shear key was constructed in F2026 to understand the impact of the excavations on the TSF and the underlying foundation material.
The outcome of the trial shear key construction and the geotechnical investigation will be used to inform the extent of the additional TSF stability measures required.
Creating sustainable value for stakeholders
ARM's net cash improved by R3 562 million to R10 171 million at 30 June 2026 (30 June 2025: R6 609 million). This gives ARM the flexibility to pursue value-enhancing growth prospects.
In F2026, total value created was R16 919 million (F2025: R12 156 million) on a segmental basis. This was distributed to stakeholders and reinvested in our business, as shown below.
| F2026 Rm |
F2025 Rm |
|
| Salaries and fringe benefits to employees | 6 007 | 6 188 |
|---|---|---|
| Taxes to government | 2 769 | 2 435 |
| Income tax | 2 325 | 1 798 |
| Royalty tax | 444 | 637 |
| Finance costs, dividends and non-controlling interest to capital providers | 3 716 | 3 328 |
| Dividends | 2 121 | 2 644 |
| Non-controlling interest | 1 167 | 179 |
| Finance costs | 428 | 505 |
| Total value distributed | 12 492 | 11 951 |
| Reinvested in the group | 4 427 | 205 |
| Amortisation | 2 550 | 2 519 |
| Reserves retained | 1 877 | (2 314) |
| Total value | 16 919 | 12 156 |
Headline earnings for F2026 increased by 19% to R3 201 million or R16.60 per share (F2025: R2 695 million or R13.79 per share). The increase in headline earnings was primarily driven by higher US dollar PGM basket prices, partially offset by lower average realised rand iron ore prices and lower local sales volumes at Beeshoek Mine.
The average realised rand strengthened by 7% versus the US dollar to R16.88/US$ compared to R18.15/US$ in F2025. For reporting purposes, the closing exchange rate at 30 June 2026 was R16.39/US$ (30 June 2025: R17.77/US$).
Headline earnings/(loss) by operation/division
| F2026 Rm |
F2025 Rm |
% change |
|
| ARM Ferrous | 2 028 | 3 472 | (42) |
|---|---|---|---|
| Iron ore division | 1 880 | 3 160 | (41) |
| Manganese division | 100 | 315 | (68) |
| Consolidation adjustment | 48 | (3) | >200 |
| ARM Platinum | 1 345 | (1 288) | >200 |
| Two Rivers Mine | 1 202 | 202 | >200 |
| Modikwa Mine | 683 | (43) | >200 |
| Bokoni Mine | (579) | (1 392) | 58 |
| Nkomati Mine | 39 | (55) | 171 |
| ARM Coal | (428) | 47 | >(200) |
| Goedgevonden Mine (GGV) | (73) | 134 | (154) |
| PCB operations* | (355) | (87) | >(200) |
| ARM Corporate and other | 256 | 464 | (45) |
| Corporate and other (including gold) | 382 | 558 | (32) |
| Machadodorp Works | (126) | (94) | (34) |
| Headline earnings | 3 201 | 2 695 | 19 |
* PCB refers to Participative Coal Business.
ARM Ferrous headline earnings decreased by 42% to R2 028 million (F2025: R3 472 million), driven by lower contributions from both the iron ore and manganese divisions. The iron ore division's headline earnings decreased by 41%, while the manganese division's decreased by 68%.
The cessation of production at Beeshoek Mine resulted in local sales volumes decreasing to 0.5 million tonnes (F2025: 2 million tonnes). The reduction in sales volumes, retrenchment costs of R124 million, an increase in the rehabilitation provision of R191 million and care and maintenance costs of R92 million collectively had a significant negative impact on headline earnings.
Headline earnings at Khumani Mine decreased significantly, mainly due to the average realised rand strengthening by 7% versus the US dollar, partially offset by 180 000 tonnes higher export sales volumes.
Manganese headline earnings declined mainly due to the average realised rand strengthening by 7% versus the US dollar and lower manganese ore and alloy export prices.
ARM Platinum headline earnings increased by more than 200% to R1 345 million (F2025: R1 288 million loss), mainly due to the strengthening of the US dollar PGM basket prices.
Two Rivers Mine headline earnings increased by more than 200% to R1 202 million (F2025: R202 million), mainly due to a 56% improvement in the average PGM rand basket price. The mine's production decreased marginally, while unit cash costs (rand per 6E PGM ounce) increased by 13%.
Modikwa Mine headline earnings increased by more than 200% to R683 million (F2025: R43 million loss), mainly due to a 54% improvement in the average PGM rand basket price. The mine's production decreased by 3%, while unit cash costs (rand per 6E PGM ounce) increased by 8%.
Bokoni Mine reported a headline loss of R579 million (F2025: R1 392 million loss). The board approved the Bokoni 180 000 tonnes per month (ktpm) development project following the completion of the DFS in June 2026.
For details and a table showing the mark-to-market adjustments at Two Rivers, Modikwa and Bokoni mines, refer to operational performance.
Nkomati Mine reported headline earnings of R39 million (F2025: R55 million loss). The mine sold 28 111 tonnes of chrome concentrate during the period.
ARM Coal reported a headline loss of R428 million (F2025: R47 million earnings), mainly driven by a decrease in the realised coal price as well as the average realised rand strengthening by 7% versus the US dollar.
The Goedgevonden Coal Mine (GGV) recorded a headline loss of R73 million (F2025: R134 million earnings). PCB recorded a headline loss of R355 million (F2025: R87 million loss).
Refer to operational performance for a detailed analysis of the GGV and PCB operational profit performance.
ARM Corporate and other (including gold) reported headline earnings of R382 million (F2025: R558 million). Included in ARM Corporate and other are dividends received from Harmony of R512 million (F2025: R240 million) and management fees received from Assmang of R1 075 million (F2025: R1 366 million).
Machadodorp Works reported a headline loss of R126 million (F2025: R94 million loss) related to research on developing energy-efficient smelting technology.
Basic earnings and impairments
Basic earnings of R3 998 million (F2025: R330 million) included attributable impairment reversals as follows:
Basic earnings include a profit on disposal of the joint venture in Sakura of R241 million and a gain on remeasurement of ARM’s pre-existing 50% interest in Nkomati of R462 million. F2025 included an impairment loss on property, plant and equipment at Bokoni Mine of R2 209 million, with no tax effect.
Refer to note 7 of the condensed group financial statements for further details on these capital items.
Financial position and cash flow
At 30 June 2026, ARM had net cash of R10 171 million (30 June 2025: R6 609 million), an increase of R3 562 million compared to the end of F2025. This amount excludes attributable cash and cash equivalents held at ARM Ferrous (50% of Assmang) of R3 934 million (30 June 2025: R3 568 million). There was no debt at ARM Ferrous in either of the reporting periods.
Dividends received by ARM Corporate*
| F2026 Rm |
F2025 Rm |
|
| Assmang | 3 400 | 4 500 |
|---|---|---|
| ARM Coal | – | 462 |
| Harmony Gold | 512 | 240 |
| Total dividends received | 3 912 | 5 202 |
* Subsequent to year end, ARM received a dividend of R77 million from ARM Coal on 19 August 2026.
ARM Platinum received a dividend of R208 million from Modikwa; R200 million of this dividend was distributed to ARM on 25 August 2026.
Assmang is finalising its final dividend for F2026.
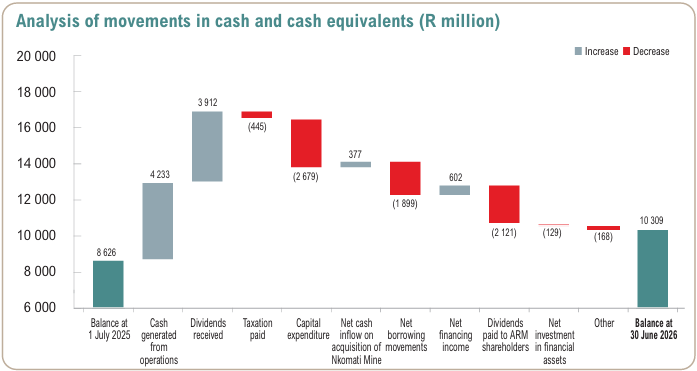
Cash generated from operations increased by R4 188 million to R4 233 million (F2025: R45 million) after an outflow in working capital of R803 million (F2025: R1 214 million). The working capital outflow was mainly due to an outflow in trade payables.
In F2026, ARM paid R2 121 million in dividends to its shareholders, representing the final dividend of R6.00 per share declared for F2025 and the interim dividend of R5.00 per share for F2026 (F2025: R2 644 million representing the F2024 final dividend of R9.00 per share and interim dividend of R4.50 per share for F2025). Net cash outflow from investing activities was R2 554 million (F2025: R2 433 million) and included R2 679 million (F2025: R2 658 million) additions to property, plant and equipment.
Borrowings of R1 899 million (F2025: R62 million) were repaid and no borrowings were raised during the period, resulting in gross debt of R157 million at 30 June 2026 (30 June 2025: R2 035 million).
Driving stability and strategic progress through logistics partnerships
Iron ore exports
Assmang, as a shareholder in the Ore Users Forum (OUF), which is an iron ore producers industry company comprising of four of South Africa's main iron ore producers, is actively working with Transnet and other industry peers to reform, stabilise and improve the ore export corridor (OEC) rail and port network to Saldanha. The collaborative efforts between the OUF and Transnet have assisted in improving export ore rail and port services, with Assmang reporting a 1% period-on-period increase in export rail performance and shipping and sales volumes.
Manganese ore exports
The Manganese Producers Consortium (MPC) is a South African entity currently representing four major manganese ore producers that account for over 60% of South Africa's exports. Although not shareholders yet, the majority of the remaining manganese ore producers support the efforts of the MPC. The MPC acts as a unified voice to drive logistics reforms in South Africa's manganese rail and port sector, ensuring reliable transport and creating an operational and cost-competitive advantage for producers in South Africa. A primary objective is to optimise manganese ore exports over the long term by reducing overall logistics costs through enhanced capital and operational efficiency.
Furthermore, the manganese ore producers, in collaboration with Transnet Rail Infrastructure Manager (TRIM), are working actively to increase the rail and port capacity to the Port of Saldanha. Simultaneously, Transnet will issue the request for qualification (RFQ) during Q1 F2027 for the design, build, construction and the operator of the new Ngqura Manganese Export Terminal, together with some Gqeberha manganese ore rail interventions. The MPC intends to respond to the RFQ to qualify for tendering for the request for proposal.
ARM Ferrous' manganese export rail performance remained relatively stable, improving by 1% period-on-period, while shipping and sales volumes decreased by 1%, mainly due to two delayed vessel loadings during June 2026.
The initiatives undertaken through the OUF and MPC demonstrate that collaboration can take many different forms and can drive developments across the logistics landscapes over the medium to long term, as South Africa's logistics reforms are accelerated to turn around performance and provide competitive, cost-effective and value-accretive logistics solutions for the long-term sustainability of South African mining producers. Importantly, considerable unutilised production capacity remains at the ARM Ferrous operations, positioning ARM to unlock meaningful upside as rail availability continues to improve.
Closure of Cato Ridge Works and Alloys, disposal of certain land assets of Assmang and Assmang's interest in Sakura
As previously reported, following the completion of a structured consultation process in terms of section 189 of the Labour Relations Act, Assmang resolved to permanently close the Cato Ridge Works complex. Operations ceased at the end of May 2025, and all affected employees were retrenched effective 31 August 2025.
Assmang executed the actions for the disposal of the Cato Ridge land, properties and houses to Assore SA PropCo, totalling R453 million (100%). On 27 June 2025, Assmang entered into binding agreements with Assore SA PropCo for the disposal of certain land parcels, properties and houses associated with the Cato Ridge complex. The aggregate purchase consideration is R453 million and will be implemented in two phases: Phase 1 for R253 million and Phase 2 for R200 million. The sale of Phase 1 properties was completed in March 2026, resulting in a profit of R225 million. The sale of Phase 2 properties is expected to be completed in F2027.
Surge Copper
ARM's investment supports the continued advancement of the Berg project, which the completed pre-feasibility study (PFS) confirms as a large-scale copper-molybdenum development with a maiden mineral reserve supporting a 28-year mine life.
Following completion of the PFS, the project is now progressing into feasibility-level technical and environmental studies, alongside the environmental assessment and permitting process and continued engagement with First Nations. The feasibility study report is planned for 2028, with the environmental assessment decision targeted for 2029 to 2030 and a final investment decision for approximately 2031. ARM will assess its continued participation through defined decision gates as the project is progressively de-risked.
Bokoni Mine
The ARM board approved the development of the Bokoni 180ktpm project following the completion of the DFS in June 2026. Bokoni is a large, high-grade, long-life UG2-led asset located on the north-eastern limb of the Bushveld Complex in Limpopo, underpinned by the second-largest PGM Mineral Resource base in South Africa.
Nkomati Mine
The ARM board approved the recommencement of open-pit mining operations and nickel concentrate production at Nkomati following the completion of the DFS, marking a low-risk, immediately actionable growth project that leverages existing mining and processing infrastructure, re-establishing South Africa's only primary nickel producer.
For further detail on both the Bokoni and Nkomati projects, please refer to the Stock Exchange News Service (SENS) announcement released on 23 July 2026 and the investor presentation conference call held on 31 July 2026, available on the ARM website https://www.arm.co.za.
Existing operations
We continued to invest in our existing operations, with segmental capital expenditure of R4 904 million for the period (F2025: R4 050 million). The increase in capital expenditure was primarily driven by expenditure at Bokoni, where R718 million was spent on mine development.
Capital expenditure by operation/division (attributable basis)
| F2026 Rm |
F2025 Rm |
% change |
|
| ARM Ferrous | 1 842 | 1 767 | 4 |
|---|---|---|---|
| Iron ore division | 1 262 | 1 341 | (6) |
| Manganese division | 588 | 506 | 16 |
| Consolidation adjustment | (8) | (80) | 90 |
| ARM Platinum | 2 759 | 1 978 | 39 |
| Two Rivers Mine | 1 017 | 1 193 | (15) |
| Modikwa Mine | 622 | 222 | 180 |
| Bokoni Mine | 1 091 | 563 | 94 |
| Nkomati Mine | 29 | – | 100 |
| ARM Coal (GGV Mine only) | 299 | 275 | 9 |
| ARM Corporate | 4 | 30 | (87) |
| Total | 4 904 | 4 050 | 21 |
ARM Ferrous: iron ore operations
Prices
Average realised US dollar export iron ore prices were 1% higher on a free-on-board (FOB) equivalent basis at US$94 per tonne (F2025: US$93 per tonne). The lump-to-fines ratio decreased from 58:42 in F2025 to 55:45 in F2026.
Movements in iron ore prices resulted in the following mark-to-market adjustments:
| F2026 Rm |
F2025 Rm |
|
| Fair value adjustments during the year (realised) | 220 | (559) |
|---|---|---|
| Revenue – fair value adjustments current period | 104 | (401) |
| Revenue – fair value adjustments previous period | 116 | (158) |
| Fair value adjustments at year end (unrealised) | (277) | (355) |
| Based on confirmed prices | (88) | (142) |
| Based on forward prices | (189) | (213) |
| Total revenue – fair value adjustments | (57) | (914) |
| Realised fair value adjustments for the period | 220 | (559) |
| Unrealised fair value adjustments for the period | (277) | (355) |
Volumes
Iron ore production volumes decreased by 9% to 13.2 million tonnes (F2025: 14.5 million tonnes), due to the cessation of production at Beeshoek Mine at the end of October 2025.
Operational performance at Khumani Mine was affected by substantial rainfall, the annual average rainfall increased by 87%, and mainly impacted 2H F2026. These adverse weather conditions reduced fleet productivity, limited access to mining areas and negatively impacted overall mining efficiency across the operation. Despite these weather-related challenges, Khumani Mine increased production by 1% to 12.4 million tonnes, 92 000 tonnes higher than prior year (F2025: 12.3 million tonnes), reflecting the resilience of the operation and the effectiveness of management's proactive and decisive response.
As previously reported, following the completion of a structured consultation process in terms of section 189 of the Labour Relations Act, Beeshoek Mine was placed on care and maintenance. This was as a result of the cessation of iron ore offtake by its sole customer, ArcelorMittal South Africa (AMSA), whose final deliveries under the month-to-month arrangement ceased on 27 July 2025. With no sustainable offtake options available after the expiry of the supply agreement and a comprehensive review confirming that alternative commercial arrangements were not economically viable, mining operations ceased on 31 October 2025. At the time, Beeshoek Mine held finished goods of 1.5 million tonnes. Following the cessation of mining, Beeshoek Mine concluded a new 1.2 million tonne offtake agreement with AMSA to sell down this stockpile, with deliveries commencing on 19 February 2026 and 402 000 tonnes sold by 30 June 2026.
Total iron ore sales volumes decreased by 9% to 12.9 million tonnes (F2025: 14.3 million tonnes). Export sales volumes increased by 1% to 12.4 million tonnes (F2025: 12.2 million tonnes), while local sales volumes decreased by 73% to 0.5 million tonnes (F2025: 2.0 million tonnes).
Unit costs
Iron ore divisional on-mine unit cash costs increased by 3% to R536 per tonne (F2025: R522 per tonne).
Khumani Mine's unit cash cost increased by 10% to R539 per tonne (F2025: R491 per tonne), mainly due to inflation (6%) and above-inflation increases in diesel, explosives, power costs and employee costs associated with the filling of critical vacancies to enhance operational stability and safety performance (4%). The increase in diesel and explosives costs was a result of the Middle East conflict and the resulting energy market volatility, although the impact was partially mitigated through ongoing cost management and operational efficiencies.
The increase in the unit cost of sales for iron ore is mainly attributable to Beeshoek, following the suspension of production at the end of October 2025, which resulted in additional non-cash inventory provisions for obsolete consumables stock and run-of-mine (RoM) stock.
Khumani Mine's unit cost of sales increased by 5% mainly due to higher on-mine unit cash costs and higher inland logistics costs resulting from 306 000 tonnes higher rail volumes. This was partially offset by lower freight costs due to the lower proportion of CIF sales volumes at 37% (F2025: 43%) and a stronger rand.
Following the cessation of production at the end of October 2025, Beeshoek Mine's on-mine unit cash cost decreased by 28%, driven by significantly lower waste stripping during the four-month production period.
Capital expenditure
Capital expenditure (100% basis) was R2 524 million (F2025: R2 681 million), which includes capitalised waste-stripping costs of R411 million (F2025: R848 million). Higher capital expenditure at Khumani Mine was offset by lower capital expenditure at Beeshoek.
Khumani Mine's capital expenditure (100% basis) increased by 7% to R2 463 million (F2025: R2 296 million) due to large fleet replacements, partially offset by lower waste-stripping expenditure.
Beeshoek Mine's capital expenditure (100% basis) decreased by 84% to R61 million (F2025: R385 million), due to no waste-stripping costs capitalised (F2025: R56 million) and the mine being placed on care and maintenance.
Iron ore operational statistics (100% basis)
| Unit | F2026 | F2025 | % change | |
| Prices | ||||
| Average realised export price* | US$/t | 94 | 93 | 1 |
| Volumes | ||||
| Export sales | 000t | 12 439 | 12 260 | 1 |
| Local sales | 000t | 552 | 2 030 | (73) |
| Total sales | 000t | 12 991 | 14 290 | (9) |
| Production | 000t | 13 245 | 14 567 | (9) |
| Export sales lump/fines split | % | 55:45 | 58:42 | |
| Export sales CIF/FOB** split | % | 37:63 | 43:57 | |
| Unit costs | ||||
| Change in unit cash costs | % | 3 | 3 | |
| Change in unit cost of sales | % | 10 | 6 | |
| Capital expenditure | R million | 2 524 | 2 681 | (6) |
* Average realised export iron ore prices on a free-on-board (FOB) equivalent basis.
** CIF – cost, insurance and freight; FOB.
ARM Ferrous: manganese ore operations
Manganese ore financial information (attributable basis)
| F2026 Rm |
F2025 Rm |
% change |
|
| Sales | 5 793 | 6 514 | (11) |
|---|---|---|---|
| Operating profit | 287 | 753 | (62) |
| Contribution to headline earnings | 219 | 543 | (60) |
| Capital expenditure | 588 | 499 | 18 |
| Depreciation | 594 | 579 | 3 |
| EBITDA | 881 | 1 332 | (34) |
Prices
The average US dollar CIF index price for high-grade manganese ore (43.5%) decreased by 5% year-on-year. The average US dollar CIF index price for low-grade manganese ore (36.5%) increased by 8% year-on-year.
Volumes
Manganese ore sales volumes were unchanged at 4.5 million tonnes (F2025: 4.5 million tonnes). Export sales volumes decreased by 1% to 3.66 million tonnes (F2025: 3.71 million tonnes). Local sales volumes increased by 7% to 0.83 million tonnes (F2025: 0.78 million tonnes) due to increased offtake from a local customer.
Production volumes at Black Rock Mine increased by 5% to 3.9 million tonnes (F2025: 3.7 million tonnes), driven by targeted operational and technical improvements, including enhanced battery electric vehicle (BEV) utilisation and drilling efficiencies, which supported a strong recovery during F2026. The improved results reflect management's proactive response to operational challenges and their ability to drive continuous improvement, resulting in enhanced operational performance.
Unit costs
Unit cash costs increased by 7% to R1 018 per tonne (F2025: R954 per tonne), mainly driven by inflationary pressures, additional employee-related costs required to enhance safety performance and regulatory compliance, costs associated with maintaining BEV and ensuring equipment complies with stringent safety standards.
Unit cost of sales, which includes marketing and distribution costs, decreased by 1%, driven by lower marketing and distribution expenses as a result of favourable foreign exchange movements during the period and the benefit of higher closing stock levels. These were partially offset by inflationary increases in operating costs.
Capital expenditure and projects
Capital expenditure and projects Capital expenditure for the manganese ore operations increased by 18% to R1 176 million on a 100% basis (F2025: R998 million). The increase is largely due to higher spending on development capital, together with a low base in the prior period when several projects were deferred and spending was curtailed to preserve cash.
Manganese ore operational statistics (100% basis)
| Unit | F2026 | F2025 | % change | |
| Volumes | ||||
| Export sales | 000t | 3 662 | 3 705 | (1) |
| Domestic sales* | 000t | 831 | 778 | 7 |
| Total sales* | 000t | 4 493 | 4 483 | – |
| Production | 000t | 3 941 | 3 761 | 5 |
| Unit costs | ||||
| Change in unit cash costs | % | 7 | 9 | |
| Change in unit cost of sales | % | (1) | 4 | |
| Capital expenditure | R million | 1 176 | 998 | 18 |
* No intra-group sales to Cato Ridge Works (F2025: 65 000 tonnes).
ARM Ferrous: manganese alloy operations
Manganese alloy financial information (attributable basis)
| F2026 Rm |
F2025 Rm |
% change |
|
| Sales | 203 | 897 | (77) |
|---|---|---|---|
| Operating loss | (64) | (266) | 76 |
| Contribution to headline losses | (121) | (228) | 47 |
| Capital expenditure | – | 7 | (100) |
| Depreciation | – | – | – |
| EBITDA | (64) | (266) | 76 |
Prices
Average high-carbon ferromanganese index prices decreased by 5% and medium-carbon ferromanganese prices decreased by 10% year-on-year.
Volumes
High-carbon ferromanganese production at Sakura up to 31 October 2025 was 81 000 tonnes (100% basis) (F2025: 222 000 tonnes). High-carbon ferromanganese sales up to 31 October 2025 were 67 000 tonnes at Sakura (100% basis) (F2025: 221 000 tonnes).
High-carbon ferromanganese production at Cato Ridge Works ceased at the end of May 2025 due to the permanent closure of the operations (F2025: 94 000 tonnes).
Medium-carbon ferromanganese production at Cato Ridge Alloys ceased at the end of May 2025 due to the permanent closure of the operations (F2025: 48 000 tonnes).
High-carbon ferromanganese sales at Cato Ridge Works decreased by 21% to 27 000 tonnes (F2025: 34 000 tonnes). Medium-carbon ferromanganese sales at Cato Ridge Alloys (100% basis) decreased by 38% to 30 000 tonnes (F2025: 48 000 tonnes).
Unit costs
Unit cash costs were not reported for Sakura, as the investment was sold on 31 October 2025 and no production occurred thereafter.
Production activities at Cato Ridge complex ceased at the end of May 2025. Only existing stock is being sold, as a result, no production costs were incurred in F2026.
Capital expenditure
No capital expenditure was incurred at Cato Ridge Works (F2025: R13 million).
Manganese alloy operational statistics (100% basis)
| Unit | F2026 | F2025 | % change | |
| Volumes | ||||
| Cato Ridge Works sales* | 000t | 27 | 34 | (21) |
| Cato Ridge Alloys sales | 000t | 30 | 48 | (38) |
| Sakura sales** | 000t | 67 | 221 | (70) |
| Cato Ridge Works production | 000t | 0 | 94 | (100) |
| Cato Ridge Alloys production | 000t | 0 | 48 | (100) |
| Sakura production** | 000t | 81 | 222 | (64) |
| Unit costs – Cato Ridge Works | ||||
| Change in unit cash costs | % | N/A | 8 | |
| Change in unit cost of sales | % | N/A | 14 | |
| Unit costs – Cato Ridge Alloys | ||||
| Change in unit cash costs | % | N/A | 1 | |
| Change in unit cost of sales | % | N/A | 9 | |
| Unit costs – Sakura | ||||
| Change in unit cash costs | % | N/A | 11 | |
| Change in unit cost of sales | % | N/A | 6 |
* No intra-group sales to Cato Ridge Alloys (F2025: 57 000 tonnes).
** Until 31 October 2025.
The ARM Ferrous operations, held through its 50% investment in Assmang Proprietary Limited (Assmang), comprise the iron ore and manganese divisions. Assore South Africa Proprietary Limited (Assore), ARM's partner in Assmang, owns the remaining 50%.
ARM Platinum
Prices
US dollar PGM prices increased significantly during F2026 when compared to prices achieved in F2025.
The average rand per 6E kilogram basket price improved as follows:
Average US dollar metal prices
| Unit | F2026 | F2025 | % change | |
| Platinum | US$/oz | 1 796 | 993 | 81 |
|---|---|---|---|---|
| Palladium | US$/oz | 1 442 | 983 | 47 |
| Rhodium | US$/oz | 8 319 | 4 767 | 75 |
| Nickel | US$/t | 16 347 | 15 746 | 4 |
| Copper | US$/t | 11 767 | 9 311 | 26 |
| Cobalt | US$/lb | 22 | 12 | 83 |
| UG2 chrome concentrate (CIF*) | US$/t | 279 | 262 | 7 |
* CIF – cost, insurance and freight.
Average rand metal price
| Unit | F2026 | F2025 | % change | |
| Average exchange rate | ZAR/US$ | 16.88 | 18.15 | (7) |
|---|---|---|---|---|
| Platinum | ZAR/oz | 30 289 | 18 026 | 68 |
| Palladium | ZAR/oz | 24 309 | 17 851 | 36 |
| Rhodium | ZAR/oz | 140 268 | 86 526 | 62 |
| Nickel | ZAR/t | 275 642 | 285 827 | (4) |
| Copper | ZAR/t | 198 403 | 169 020 | 17 |
| Cobalt | ZAR/lb | 376 | 213 | 77 |
| UG2 chrome concentrate (CIF*) | ZAR/t | 4 704 | 4 747 | (1) |
* CIF – cost, insurance and freight.
Consistent with prior periods, Two Rivers and Modikwa mines recognised revenue using provisional pricing. The sales price of the concentrate is determined on a provisional basis at the date of sale, with adjustments made to the sales price based on movements in commodity prices up to the date of final pricing.
Any differences between provisional and final pricing after the reporting period result in the next reporting period's earnings being impacted by mark-to-market adjustments.
The mark-to-market adjustments at Two Rivers and Modikwa were all positively impacted by the increase in commodity prices towards the end of F2026.
Two Rivers Mine mark-to-market adjustments
| F2026 Rm |
F2025 Rm |
|
| Assay adjustment | 233 | 241 |
|---|---|---|
| Fair value adjustment | 341 | 126 |
| Total mark-to-market adjustments | 574 | 367 |
Modikwa Mine mark-to-market adjustments
| F2026 Rm |
F2025 Rm |
|
| Assay adjustment | (13) | – |
|---|---|---|
| Fair value adjustment | 172 | 108 |
| Total mark-to-market adjustments | 159 | 108 |
Bokoni Mine mark-to-market adjustments
| F2026 Rm |
F2025 Rm |
|
| Assay adjustment | – | (7) |
|---|---|---|
| Fair value adjustment | – | 30 |
| Total mark-to-market adjustments | – | 23 |
ARM Platinum: Two Rivers Mine
Volumes
Tonnes milled were 1% lower compared to F2025. The overall grade declined to 3.00g/t (F2025: 3.03g/t). PGM production volumes declined marginally by 1% to 286 590 6E PGM ounces (F2025: 288 502 6E PGM ounces), due to productivity being impacted by sympathetic geological structures affecting mining flexibility.
Unit costs
The unit cash cost per 6E PGM ounce increased by 13% to R18 487 (F2025: R16 431), mainly driven by inflation and above-inflation increases in diesel, explosives, consumables and labour costs. Labour cost increases were 2% above inflation, resulting from increased bonus payments arising from the higher profitability. The impact of the above-inflationary cost increases on unit costs was further exacerbated by a reduction in PGM ounces produced and increased mining development costs.
Capital expenditure and projects
Capital expenditure decreased by 15% to R1 017 million (F2025: R1 193 million). Of the total capital expenditure, R524 million related to the deepening of the declines at the Main and North shafts, along with electrical and mechanical installations. A further R184 million related to expenditure on fleet replacement and rebuilds. F2025 included R267 million of capital expenditure relating to the Merensky project prior to being placed on care and maintenance.
Merensky project
A decision was taken to place the Merensky project on care and maintenance in July 2024. Prior to this transition, key capital milestones were successfully completed, including the construction of the Merensky concentrator plant and the establishment of the first two mining levels.
In October 2025, decline development selectively resumed on the Merensky on-reef decline shaft to establish additional dip levels. This targeted development enhances operational readiness, positioning the asset for an accelerated production ramp-up.
The immediate focus at Two Rivers is to fill the capacity of the UG2 concentrator plant. As a result, two Merensky stoping crews have since been deployed. The Merensky ore produced will be processed in the UG2 concentrator plant.
The development pathway for the Merensky project is expected to be submitted for board consideration in F2027. We will engage the market once an investment decision has been reached. This approach reflects our focus on disciplined capital allocation to mitigate execution risk and maximise project returns. The long-term fundamentals for the Merensky project remain robust and highly value accretive.
Two Rivers Mine operational statistics (100% basis)
| Unit | F2026 | F2025 | % change | |
| Cash operating profit | R million | 3 696 | 1 083 | >200 |
|---|---|---|---|---|
| – PGMs | R million | 3 475 | 766 | >200 |
| – Chrome | R million | 221 | 317 | (30) |
| Tonnes milled | Mt | 3.46 | 3.48 | (1) |
| Head grade | g/t, 6E | 3.00 | 3.03 | (1) |
| PGMs in concentrate | Ounces, 6E | 286 590 | 288 502 | (1) |
| Chrome in concentrate sold | Tonnes | 125 504 | 153 507 | (18) |
| Average basket price | ZAR/kg, 6E | 1 219 876 | 780 569 | 56 |
| Average basket price | US$/oz, 6E | 2 250 | 1 337 | 68 |
| Cash operating margin | % | 37 | 17 | |
| Cash cost | ZAR/kg, 6E | 594 383 | 528 264 | 13 |
| Cash cost | R/tonne | 1 531 | 1 360 | 13 |
| Cash cost | ZAR/Pt oz | 40 363 | 35 645 | 13 |
| Cash cost | ZAR/oz, 6E | 18 487 | 16 431 | 13 |
| Cash cost | US$/oz, 6E | 1 096 | 905 | 21 |
ARM Platinum: Modikwa Mine
Volumes
Tonnes milled improved by 1% to 2.45 million tonnes (F2025: 2.43 million tonnes). While underground UG2 development is currently being ramped up, face-length availability remained constrained during the year as a result of previous development delays. As a transitional measure to offset these historical shortfalls, open-pit mining was introduced in F2025 to maintain plant feed. PGM production decreased by 3% to 273 671 6E PGM ounces (F2025: 281 638 6E PGM ounces), reflecting temporary plant recovery impacts caused by blending open-pit ore into the feed mix.
Unit costs
Unit cash costs were up 8% to R20 909 per 6E PGM ounce (F2025: R19 399 per 6E PGM ounce), largely due to the above-inflationary increase in diesel costs and a 3% reduction in PGM ounce production.
Capital expenditure and projects
Capital expenditure at Modikwa Mine (100% basis) increased by 180% to R1 244 million (F2025: R444 million). Of the total capital expenditure incurred, R100 million related to capital development, R294 million related to fleet refurbishment and critical spares, R273 million related to infrastructure capital expenditure and R250 million related to waste stripping at the open-pit.
North shaft project
The downcast ventilation project was initiated to provide additional ventilation for mining levels below level 10. Safe holing concluded on 6 June 2026 and the thin concrete layer (TCL) application process was concluded at the end of August 2026.
South 2 shaft project
The underground-to-surface conveyor belt that connects South 2 infrastructure to South 1 shaft (BA belt project) has been re-baselined due to operational complexities and site preparation delays. Construction is progressing and the forecast completion date is October 2026. This delay will not negatively impact production.
Open-pit project
Modikwa commenced open-pit mining in 2024, with initial trial pits developed in the South 1 area, while permitting and access were being finalised for the larger South 3 pit. Mining at the larger South 3 open-pit, located on the Winterveld farm, began in the second half of 2025. The project is currently producing 35 000 tonnes per month.
Merensky project
The Merensky mining project is progressing well, with volumes at 50 000 tonnes per month.
Modikwa Mine operational statistics (100% basis)
| Unit | F2026 | F2025 | % change | |
| Cash operating profit | R million | 2 581 | 211 | >200 |
|---|---|---|---|---|
| – PGMs | R million | 2 362 | 87 | >200 |
| – Chrome | R million | 219 | 124 | 77 |
| Tonnes milled | Mt | 2.45 | 2.43 | 1 |
| Head grade | g/t 6E | 4.41 | 4.48 | (2) |
| PGMs in concentrate | 6E oz | 273 671 | 281 638 | (3) |
| Chrome in concentrate sold | Tonnes | 93 112 | 98 818 | (6) |
| Average basket price | ZAR/kg 6E | 1 194 926 | 778 192 | 54 |
| Average basket price | US$/oz 6E | 2 204 | 1 333 | 65 |
| Cash operating margin | % | 31 | 4 | |
| Cash cost | ZAR/kg 6E | 672 232 | 623 679 | 8 |
| Cash cost | ZAR/tonne | 2 332 | 2 246 | 4 |
| Cash cost | ZAR/Pt oz | 48 053 | 45 428 | 6 |
| Cash cost | ZAR/oz 6E | 20 909 | 19 399 | 8 |
| Cash cost | US$/oz 6E | 1 240 | 1 069 | 16 |
ARM Platinum: Bokoni Mine
The board approved the development of the Bokoni 180ktpm project following the completion of the DFS in June 2026.
The project is expected to deliver an NPV of R5.9 billion, based on the future capital expenditure of R15.2 billion and a nominal post-tax discount rate of 18.47%. The expected IRR on the future cash flows is 28.0%, with a payback period of 6.3 years.
First production from the refurbished 60ktpm concentrator is scheduled for 1H F2028, followed by commissioning of the new 120ktpm concentrator in 2H F2030, with steady-state production of approximately 350 000 to 400 000 6E PGM ounces per annum. The phased, brownfield-led approach materially de-risks execution and positions Bokoni below the 50th percentile of the global PGM cost curve, reinforcing ARM's positioning as a globally competitive, low-cost PGM producer.
For further details, refer to the SENS announcement released on 23 July 2026 and the investor presentation conference call held on 31 July 2026, available on the ARM website https://www.arm.co.za.
Capital expenditure
Of the R1 091 million spent at Bokoni, R718 million related to mine development and R193 million related to the tunnel-boring machine (TBM).
The strategic development focus for F2026 was to establish the critical infrastructure and mining access required to support sustainable production growth. Key activities included advancing the 02 Level East, 03 Level East and West Footwall drives. Development also progressed towards the planned ventilation shafts. In addition, the conveyor and material declines were extended to 04 Level. These initiatives were aimed at improving mine access, enhancing ventilation capacity and creating the platform necessary for future production expansion.
A total of 2 684 metres of off-reef development was completed during the period, inclusive of the main decline systems. In addition, 377 metres of on-reef development was achieved, with 80% of this work executed within the final five months of the financial year, following the successful recruitment and deployment of dedicated on-reef development crews. This accelerated delivery reflects the effectiveness of the resourcing strategy and demonstrates a strong commitment to building mining flexibility and unlocking future ore reserves.
The TBM infrastructure was successfully constructed, fully commissioned and handed over ahead of schedule during November 2025. Once the TBM turned onto strike, ground conditions improved and development reached 279 metres at the end of June 2026.
Bokoni Mine operational statistics (100% basis)
| Unit | F2026 | F2025 | % change | |
| Cash operating loss | R million | – | (868) | – |
|---|---|---|---|---|
| Tonnes milled | Mt | – | 0.52 | – |
| Head grade | g/t 6E | – | 4.42 | – |
| PGMs in concentrate | 6E oz | – | 45 579 | – |
| Average basket price | ZAR/kg 6E | – | 778 541 | – |
| Average basket price | US$/oz 6E | – | 1 334 | – |
| Cash operating margin | % | – | (105) | – |
| Cash cost | ZAR/kg 6E | – | 1 197 070 | – |
| Cash cost | ZAR/tonne | – | 3 262 | – |
| Cash cost | ZAR/Pt oz | – | 97 605 | – |
| Cash cost | ZAR/oz 6E | – | 37 233 | – |
| Cash cost | US$/oz 6E | – | 2 051 | – |
ARM Platinum: Nkomati Mine
Nkomati has been on care and maintenance since F2021.
Following ARM's acquisition of full ownership of Nkomati Nickel Mine (Nkomati) in July 2025, management has been able to streamline governance, accelerate decision-making and advance a clear restart pathway for the asset. Nkomati remained a key strategic focus for ARM during the year, as the group moved from preserving the asset under care and maintenance to positioning it for value creation.
In July 2026, the ARM board approved the recommencement of open-pit mining operations and nickel concentrate production at Nkomati, following completion of the DFS and the conclusion of the nickel concentrate offtake agreement with Boliden Commercial AB (Boliden). The offtake agreement has not yet become unconditional and remains subject to the fulfilment or waiver, as applicable, of the remaining conditions precedent relating to the establishment of acceptable loading port access.
The restart of Nkomati's open-pit nickel mining operations represents a low-risk, immediately actionable development opportunity. The project leverages Nkomati's existing mining and processing infrastructure and is underpinned by a large polymetallic resource with a secured nickel concentrate offtake arrangement, which re-establishes South Africa's only primary nickel producer.
Management's near-term focus is on execution readiness, including finalising the remaining offtake agreement conditions precedent, preparing the open-pit and processing operations for restart, maintaining cost discipline and advancing the chrome recovery and optimisation opportunities that could further enhance the long-term economics of the asset.
For further detail, refer to the SENS announcement released on 23 July 2026 and the investor presentation conference call held on 31 July 2026, available on the ARM website https://www.arm.co.za.
At 30 June 2026, the estimated undiscounted rehabilitation costs were determined to be R2 191 million (30 June 2025: R2 301 million), excluding VAT. The discounted rehabilitation costs were determined to be R1 641 million at 30 June 2026 (30 June 2025: R2 123 million).
At 30 June 2026, R381 million in cash and financial assets was available to fund rehabilitation obligations for Nkomati Mine.
Nkomati Mine's estimated rehabilitation costs continue to be reassessed as engineering designs evolve and new information becomes available.
ARM Coal
Prices
GGV's average export coal price received decreased by 5% to US$78/tonne (F2025: US$82/tonne). PCB's average export coal price received decreased by 3% to US$73/tonne (F2025: US$75/tonne).
API4 commodity prices recovered marginally in 2H F2026 from depressed market conditions in 1H F2026. The global coal market experienced resilient demand in 2H F2026 amidst geopolitical-related price increases. Prices increased due to Middle East tensions and weather-related restocking. In addition, China's coal market experienced declining domestic production and weak wind output, resulting in thermal coal price support.
Approximately 71% and 65% of export volumes at GGV Mine and PCB, respectively, comprised high-quality coal. Export revenue in F2026 was negatively impacted by the average realised rand strengthening by 7% versus the US dollar.
ARM Coal: Goedgevonden Mine (GGV)
GGV attributable headline earnings analysis
| F2026 Rm |
F2025 Rm |
% change |
|
| Cash operating profit | 148 | 453 | (67) |
|---|---|---|---|
| Amortisation and depreciation | (241) | (264) | 9 |
| Net finance (cost)/income | (6) | (31) | 81 |
| Loss on sale of assets | (2) | (1) | (100) |
| Loan remeasurement and fair value losses | (19) | (16) | (19) |
| (Loss)/profit before taxation | (120) | 141 | (185) |
| Add: profit on sale of assets | 2 | 1 | 100 |
| Less: taxation | 45 | (8) | >200 |
| Headline (loss)/earnings attributable to ARM | (73) | 134 | (154) |
Volumes
ARM attributable saleable production increased by 2% to 1.78 million tonnes (F2025: 1.74 million tonnes). Transnet Freight Rail (TFR) performance improved marginally during the reporting period, enabling increased production.
Unit costs
On-mine unit production costs per saleable tonne increased by 5% to R668 per tonne (F2025: R634 per tonne), as the impact of higher diesel prices was partially offset by the increased saleable production.
Capital expenditure
Capital expenditure (100% basis) increased by 9% to R1 150 million (F2025: R1 057 million), largely due to increased asset decommissioning expenditure for future rehabilitation.
GGV operational statistics
| Unit | F2026 | F2025 | % change | |
| Total production and sales (100% basis) | ||||
| Saleable production | Mt | 6.86 | 6.71 | 2 |
| Export thermal coal sales | Mt | 3.64 | 3.61 | 1 |
| Domestic thermal coal sales | Mt | 3.18 | 3.06 | 4 |
| ARM attributable production and sales | ||||
| Saleable production | Mt | 1.78 | 1.74 | 2 |
| Export thermal coal sales | Mt | 0.95 | 0.94 | 1 |
| Domestic thermal coal sales | Mt | 0.83 | 0.80 | 4 |
| Average received coal price | ||||
| Export (FOB)* | US$/t | 77.80 | 81.89 | (5) |
| Domestic (FOT)** | ZAR/t | 434 | 422 | 3 |
| Unit costs | ||||
| On-mine saleable cost | ZAR/t | 668 | 634 | 5 |
| Capital expenditure (100% basis) | R million | 1 150 | 1 057 | 9 |
* FOB – free-on-board.
** FOT – free-on-truck.
ARM Coal: Participative Coal Business (PCB)
PCB attributable headline earnings analysis
| F2026 Rm |
F2025 Rm |
% change |
|
| Cash operating profit | 91 | 407 | (78) |
|---|---|---|---|
| Amortisation and depreciation | (577) | (527) | (10) |
| Loss before taxation | (486) | (120) | >(200) |
| Less: taxation | 131 | 33 | >200 |
| Headline loss attributable to ARM | (355) | (87) | >(200) |
Volumes
Export sales volumes at the PCB operation increased by 3% to 8.2 million tonnes (F2025: 8.0 million tonnes), mainly as a result of the improved performance from TFR. Domestic sales volumes declined by 17% to 0.99 million tonnes (F2025: 1.19 million tonnes) largely due to decreased coal sales to Eskom.
ARM attributable saleable production increased by 2% to 1.92 million tonnes in F2026 (F2025: 1.89 million tonnes).
Unit costs
Unit production costs per saleable tonne increased by 2% to R867 per tonne (F2025: R849 per tonne).
PCB operational statistics
| Unit | F2026 | F2025 | % change | |
| Total production sales (100% basis) | ||||
| Saleable production | Mt | 9.49 | 9.36 | 1 |
| Export thermal coal sales | Mt | 8.23 | 7.96 | 3 |
| Domestic thermal coal sales | Mt | 0.99 | 1.19 | (17) |
| ARM attributable production and sales | ||||
| Saleable production | Mt | 1.92 | 1.89 | 2 |
| Export thermal coal sales | Mt | 1.66 | 1.61 | 3 |
| Domestic thermal coal sales | Mt | 0.20 | 0.24 | (17) |
| Average received coal price | ||||
| Export (FOB)* | US$/t | 73.34 | 75.49 | (3) |
| Domestic (FOT)** | ZAR/t | 823 | 762 | 8 |
| Unit costs | ||||
| On-mine saleable cost | ZAR/t | 867 | 849 | 2 |
| Capital expenditure (100% basis) | R million | 1 977 | 2 165 | (9) |
* FOB – free-on-board.
** FOT – free-on-truck.
ARM’s economic interest in PCB is 20.2%. PCB consists of two large mining complexes in Mpumalanga. ARM has a 26% effective interest in the GGV Mine near Ogies in Mpumalanga.
ARM's investment in Harmony was positively revalued by R388 million in F2026 (F2025: R5 731 million) as the Harmony share price increased by 2% from R244.81 at 30 June 2025 to R250.00 at 30 June 2026. The Harmony investment is, therefore, reflected on the ARM statement of financial position at R18 667 million (F2025: R18 279 million) based on its share price.
Gains and losses are accounted for, net of deferred capital gains tax, through the statement of comprehensive income. Dividends recieved from Harmony are recognised in the ARM statement of profit or loss on the last day of registration following dividend declaration.
In F2025, ARM designated an equity collar over 18 million Harmony shares to hedge the fair value risk associated with changes in the listed share price of those shares. These shares represent 24% of the 74 665 545 Harmony shares owned by ARM. Risks and rewards to the Harmony shares are retained by ARM. Refer to note 22 of the condensed group financial statements for more information.
Harmony headline earnings per share increased by 87% to 4 363 cents per share (F2025: 2 337 cents per share).
Net profit increased by 102% to R29 453 million (F2025: R14 548 million).
Harmony's results for the year ended 30 June 2026 can be found on its website www.harmony.co.za.
According to the International Monetary Fund, global economic growth is projected to slow to 3.1% for the remainder of 2026, before edging up to 3.2% in 2027. This is below the pace of about 3.4% recorded in 2024 to 2025. The outbreak of war in the Middle East and the closure of the Strait of Hormuz have lifted energy prices and pushed global headline inflation up to 4.4% in 2026. Advanced economies continue to grow slowly amid tighter financial conditions, while many commodity-importing emerging markets remain constrained by debt burdens and elevated fragility. Downside risks persist, including the potential for a prolonged or wider conflict, a renewed surge in energy prices and heightened geopolitical tensions, any of which could weigh on economic growth and disrupt global supply chains.
South Africa's economic outlook remains resilient, though the Middle East conflict has interrupted global disinflation and lifted the inflation outlook, with oil, gas and other commodity prices rising sharply. As major central banks pause rate cuts amid heightened uncertainty, South African assets have proven relatively resilient, underpinned by improved macro-economic fundamentals. These spillovers are expected to delay rather than derail the return to the 3% inflation target set by the South African Reserve Bank. Headline inflation is projected to rise for the remainder of 2026 before returning to target by late 2027. Domestic growth strengthened to 1.1% in 2025 and is expected to approach 2% by 2028, with resilience increasingly dependent on domestic factors and continued structural reform.
Iron ore prices rallied and then fell in the first half of 2026, with the swing driven mainly by costs rather than market fundamentals. Surging bunker and freight costs caused by the US/Iran conflict pushed prices higher. However, the late-June US-Iran Memorandum of Understanding eased fears over the Strait of Hormuz, which deflated the risk premium and drove freight costs sharply lower; this pulled prices back to pre-war levels. With the cost support having faded, weak fundamentals now dominate, including ample supply, record year-to-date imports in May that kept Chinese port stocks elevated and a structural decline in demand that leaves global demand broadly flat. On the supply side, rising energy and freight costs pressured higher-cost producers, which included Brazilian juniors, Canadian and West African operations, while the majors held output steady. Simandou continued to ramp up quickly despite wet-season disruptions. The medium-term outlook remains bearish, with softer prices and compressed high-grade premiums weighing on South African exporters. This highlights the need for cost discipline and product quality, although a rising cost floor should support a more constructive medium-term outlook.
Similar to the iron ore market, during 2026, the manganese market was driven by cost inflation rather than market fundamentals. The US/Iran conflict lifted manganese ore costs through higher oil and diesel prices; with trucking to South African ports particularly affected, prices eased by the end of July as the cost push faded. Supply has been strong year to date, with South African exports robust on recovering Transnet rail performance and improved trucking capacity. Chinese manganese ore imports surged, pushing port stocks higher as imports exceeded demand. Demand, however, is softening, led by China, where lower steel output is reducing ferroalloy production and, in turn, manganese ore requirements, leaving the market oversupplied in certain segments. The short-term outlook remains bearish, with softer Chinese smelter demand and elevated port stocks reinforcing the downside. Over the medium term, however, the outlook firms, as a higher cost floor and tighter supply are expected to lift prices modestly.
PGM prices rallied in early 2026 before retreating below their opening levels, though they remain above 2025 averages. Amended European CO2 legislation, requiring a 90% emissions cut rather than an outright 2035 ban on internal combustion engines, is expected to prolong the use of PGM-containing autocatalysts. The long-term demand outlook remains constructive despite the headwinds from BEV penetration. Industrial platinum demand is expected to grow, led by glass and hard disc drive demand, while palladium demand over the long term is supported by a widening gold-to-palladium ratio and data-centre-driven electrical substitution. Rhodium demand is forecast to grow at a robust compound annual growth rate of 2.5% by 2040, underpinned by new glass capacity and steady nitric acid production. On the supply side, primary PGM output is forecast to decline over the medium to long term, with South Africa remaining the dominant source of supply pressure given accelerating Merensky and UG2 shaft depletion and persistent underinvestment, while Zimbabwe and North America face further structural decline. Together, these dynamics point to a supportive PGM price outlook over the medium to long term.
Nickel shifted to a higher trading range in 2026, with the market still reluctant to price a sustained deficit as inventories remain elevated. The defining development was Indonesia's April 2026 policy revision, which lifted cost support and effectively set the marginal cost of supply. Demand is expected to improve, driven mainly by stainless steel production. In addition, demand will likely be supported by infrastructure, shipbuilding, autos, appliances and a recovery in battery demand. On the supply side, global output is anticipated to fall in the near term, as binding Indonesian policy curtails supply. The medium-term outlook is not yet a deficit story, as inventories remain elevated and supply growth should resume beyond 2026.
The thermal coal market has undergone structural decline while exhibiting short-term resilience. Prices rose through the second quarter of 2026 as the Middle East conflict lifted the liquefied natural gas (LNG) prices and resulted in gas-to-coal switching being economical, before easing as the Strait of Hormuz began to reopen.
This substitution-driven strength lifted first-half prices and the annual average, rather than reflecting genuine demand growth, leaving a weaker second half. Thermal coal prices are expected to remain subdued over the medium term due to weaker demand, robust supply and higher renewable output.
Despite the ongoing commodity market volatility, ARM remains optimistic about the medium to long-term outlook for the mining sector and the commodities we mine and beneficiate. With a portfolio of quality, long-life assets and world-class ore bodies, ARM is well-positioned to navigate the uncertain commodity and economic environment. We continue to strengthen resilience by driving productivity and improving cost efficiency and disciplined capital allocation. ARM is committed to creating sustainable value for our shareholders and all stakeholders.
ARM aims to pay ordinary dividends to shareholders in line with our dividend-guiding principles. Dividends are at the discretion of the board of directors, which considers the company's capital allocation guiding principles and other relevant factors such as financial performance, commodities outlook, investment opportunities, gearing levels, as well as solvency and liquidity requirements of the Companies Act.
For F2026, the board approved and declared a final dividend of 700 cents per share (gross) (F2025: 600 cents per share). The amount to be paid is approximately R1 461 million.
The dividend declared will be subject to dividend withholding tax. In line with the JSE Listings Requirements, the following additional information is disclosed:
A gross dividend of 700 cents per ordinary share, being the dividend for the year ended 30 June 2026, has been declared payable on Monday, 12 October 2026 to those shareholders recorded in the books of the company at the close of business on Friday, 9 October 2026. The dividend is declared in the South African currency. Any change in address or dividend instruction applying to this dividend must be received by the company's transfer secretaries or registrar no later than Friday, 9 October 2026. The last day to trade ordinary shares cum dividend is Tuesday, 6 October 2026. Ordinary shares trade ex-dividend from Wednesday, 7 October 2026. The record date is Friday, 9 October 2026, while the payment date is Monday, 12 October 2026.
No dematerialisation or rematerialisation of share certificates may occur between Wednesday, 7 October 2026 and Friday, 9 October 2026, both dates inclusive, nor may any transfers between registers take place during this period.
There has been no material change to ARM's Mineral Resources and Mineral Reserves as disclosed in the integrated annual report for the financial year ended 30 June 2025, apart from:
Beeshoek Iron Ore Mine
No Mineral Reserves are reported for Beeshoek. The operation is in the process of transitioning to care and maintenance due to the absence of a supply agreement under prevailing market constraints, which currently limits the ability to support sustained mining. Previously reported Mineral Reserves have been reclassified as Mineral Resources.
Bokoni Platinum Mines
No Mineral Reserves are reported for Bokoni. The DFS is being reviewed and refined based on insights gained from the recent initial mining outcomes. The operation is shifting its focus to strategically de-risking the project, while continuing key capital development in support of a phased approach.
An updated Mineral Resources and Mineral Reserves statement will be issued in our 2026 integrated annual report.
As announced on SENS, the following changes to the board have taken place during F2026:
Signed on behalf of the board
VP TOBIAS
Chief executive officer
TTA MHLANGA
Finance director
Johannesburg
4 September 2026
To the shareholders of African Rainbow Minerals Limited
Introduction
We have reviewed the accompanying condensed group statement of financial position of African Rainbow Minerals Limited ("the Group") at 30 June 2026, the condensed group statements of profit or loss, comprehensive income, changes in equity and cash flows for the year then ended, and notes to the condensed group financial statements, as set out in the financial performance and notes ("the condensed group financial statements").
The Directors are responsible for the preparation and presentation of the condensed group financial statements in accordance with IAS 34, Interim Financial Reporting and the requirements of the South African Companies Act. Our responsibility is to express a conclusion on these condensed group financial statements based on our review.
Scope of Review
We conducted our review in accordance with the International Standard on Review Engagements 2410, "Review of Interim Financial Information Performed by the Independent Auditor of the Entity". A review of condensed group financial statements consists of making inquiries, primarily of persons responsible for financial and accounting matters, and applying analytical and other review procedures. A review is substantially less in scope than an audit conducted in accordance with International Standards on Auditing and consequently does not enable us to obtain assurance that we would become aware of all significant matters that might be identified in an audit. Accordingly, we do not express an audit opinion.
Conclusion
Based on our review, nothing has come to our attention that causes us to believe that the accompanying condensed group financial statements at 30 June 2026 are not prepared, in all material respects, in accordance with IAS 34, Interim Financial Reporting and the requirements of the South African Companies Act.
KPMG Inc.
Registered Auditor
Per C Basson
Chartered Accountant (SA)
Registered Auditor
Director
4 September 2026
85 Empire Road
Parktown
2193